The #1 Trader's News

Thursday, July 24, 2025

🚀 Top 4 Buy Signals Lighting Up Mastercard (MA) | Rocket Booster Strategy

Mastercard Inc. (MA) is showing explosive potential, and it’s not just one signal—it’s a whole confluence of confirmations. When


you align this much market momentum, you don’t ignore it. Let’s break down how Rocket Booster Strategy gives us a powerful buy indication on the daily chart.

🔍 The Confluence Setup

1. DMI Buy Signal

The Directional Movement Index (DMI) is in bull mode. ADX is

rising and the +DI is firmly above -DI. This shows the trend is not just alive—it’s gaining strength.

🔻 2. Volume Oscillator Pullback

While Volume Oscillator is down, this is seen as constructive and not bearish. It suggests a quiet zone before the thrust—just like fuel loading before a rocket launch.

Smart traders know: momentum can build silently.

💥 3. Awesome Oscillator = Strong Buy

The Awesome Oscillator is green and firing hard. We’ve seen a clear twin-peak bullish formation followed by a break above zero

—classic acceleration sign.

🕯️ 4. Rising Window (Japanese Candlestick Pattern)

A Rising Window—a bullish continuation gap—has formed. This is one of Steve Nison’s top continuation patterns. It signals strong

institutional conviction in this trend.

📈 What Does This Mean?

When DMI, AO, candlestick patterns, and our own Rocket Booster Strategy all point up, it’s time to pay attention. This setup is rare—and high-probability.

🧠 Rocket Booster Strategy Recap

This strategy uses 3 momentum alignment points:


  1. High Momentum Indicator (like AO) in Buy Mode

  2. Pattern Confirmation (Rising Window or Engulfing)

  3. Volume Correction Before Breakout (Fuel Before Fire)


When all 3 click into place, we have ignition.

🎯 Final Thoughts

Mastercard is looking primed for takeoff on the daily timeframe. Whether you’re an investor or a swing trader, this chart is

speaking loud and clear. But as always, risk management is your co-pilot.

  • ✅ Add it to your watchlist.
  • 🚀 Simulate entries.
  • 🧠 Trust the confluence.


Rocket Boost This Content To Learn More

Disclaimer: This is not financial advice. Always use a simulation/demo account before committing real capital. Trade responsibly.

Sunday, July 20, 2025

🚀 The 3-Step Rocket Booster Strategy – UK100 Bullish Breakout Brewing

The UK100 Index is currently aligning perfectly with a high-probability setup I call the 3-Step Rocket Booster Strategy

— a momentum-based play designed to catch strong breakouts before the crowd reacts.

---

🔍 Strategy Breakdown:

  1. ✅ Step 1: Price above the 50 EMA

    This signals short-term bullish momentum. The UK100 has cleared the 50 EMA decisively, with candles holding strong above it — suggesting buyers are stepping in aggressively.

  2. ✅ Step 2: Price above the 200 EMA

    Now we’ve got long-term trend confirmation. The index is trending above the 200 EMA, meaning bulls have full control of the higher timeframe direction.

  3. ⚠️ Step 3: The Gap-Up with Volume Confirmation

    Here’s the key — the "booster". We’re watching for a gap-up move, validated by a Volume Oscillator breakout. While

    price has already lifted, the volume hasn’t exploded just yet — this is the final ignition phase before liftoff.


---

📈 Technical Indicators:

  1. MACD: Bullish crossover active — momentum building

  2. Volume Oscillator: Starting to curve upward, hinting at upcoming volume expansion

  3. EMAs: 50 EMA > 200 EMA = confirmed bullish structure
    Support Zones: Holding cleanly above recent resistance-turned-support, adding confluence


---

🟢 Trade Insight:

We are now sitting in the perfect entry zone — price is in the pocket before volume confirms. Once volume breaks out, we could see a parabolic move, especially if global market sentiment remains stable.

🎯 Potential Targets:

  1. First target: Recent high (psychological + structural level)
  2. Second target: Measured move based on gap range extension
  3. Risk: A close below the 50 EMA invalidates the setup


---

🔁 Summary:

This setup ticks all three boxes of the 3-Step Rocket Booster Strategy.

The smart money is positioning before the volume shows up. The UK100 is a strong bullish candidate with low-risk entry and high reward potential — don’t ignore this one.

---


📌Disclaimer: Always use proper risk management. Trade the setup, not the emotion.Use a simulation trading account before you trade with real money

Let me know if you’re tracking this setup too 👇

Saturday, July 19, 2025

The 3 Powerful Signals Explained In Under 10 Minutes.. [Watch Now]

 Am lubosi forex and i would like to welcome you to my YouTube channel.This is where i share with you technical analysis strategies. 

I started trading in 2017 and learning about it has not been easy.My hope for you is that this channel will shape your trading journey and help you Find a path to 

making money on your own terms. In this video am showing you the rocket booster strategy using 3 indicators and catalysts as follows: 

  • 1-Volume Oscillator 
  • 2-MACD Indicator 
  • 3-Earnings Report Catalyst 


These 3 power signals boost the 3-step rocket 

booster strategy 


Watch this video on YouTube to learn more 


Disclaimer:Trading is 

risky please use a simulation trading account before you trade with real money also 

learn risk management and profit taking strategies.

Friday, July 18, 2025

🚀 3 Reasons Why Nvidia (NVDA) Looks Bullish Right Now

Nvidia is showing strong signs of a bullish breakout. Here are 3 solid technical reasons why NVDA could be ready to lift off 📈

1️⃣ Candlestick pattern – long lower shadow

The long lower shadow signals buyers stepped in after early selling pressure. This shows strong demand at lower prices — classic bullish behavior.

2️⃣ High daily volume

Nvidia is trading on increased volume today, confirming that big players are active. High volume validates the price action and increases the reliability of the bullish setup.

3️⃣ Reversal on the volume oscillator

The volume oscillator is reversing from below zero, signaling momentum may be shifting back to the bulls. This indicates a potential trend change just before a new rally begins.

🔥 Bonus: Rocket Booster Strategy
NVDA fits the Rocket Booster Strategy:

  1. Price is above the 50 EMA
  2. Price is above the 200 EMA
  3. A recent gap up confirmed by candlestick support


When all these factors align, it’s like lighting the engines for a bullish liftoff.

Rocket boost this content to learn more
---


⚠️ Disclaimer: Always use a simulation (demo) account before trading with real money. Learn proper risk management and profit-taking strategies to protect your capital.

Tuesday, July 15, 2025

3 Reasons Why Cisco Stock Is Ready to Rocket 🚀 (Bonus Strategy Inside)


Cisco Systems ($CSCO) is showing signs of a potential breakout — and savvy traders should take notice. Here’s why this tech giant is gathering bullish momentum across multiple signals:

1️⃣ Long Lower Shadow Candlestick Pattern

A long lower shadow on the recent candle suggests strong rejection of lower prices. This shows that buyers stepped in aggressively after an intraday dip — a classic bullish reversal sign that often marks the end of a pullback phase.

2️⃣ Volume Oscillator Below Zero

The volume oscillator dipping below zero may seem bearish at first, but in context, it shows a decline in selling pressure. When paired with other bullish indicators, this can signal the calm before a strong move upward — especially if bulls take control on the next candle.

3️⃣ High Volume on the 4H Time Frame

Volume doesn’t lie — and it’s surging on the 4-hour chart. This spike in volume at key support levels adds strong confirmation that institutional players may be stepping in. When volume rises while price action forms reversal candles, it increases the probability of a sustained upward move.


🚀 Bonus Reason: The Rocket Booster Strategy is in Play

Cisco is also aligning with the Rocket Booster Strategy, which requires:

  • Price trading above the 50 EMA
  • Price trading above the 200 EMA
  • A recent gap up confirmed by Parabolic SAR
  • Strong supporting volume

This strategy acts like ignition for high-momentum trades — and Cisco looks ready for lift-off.


📌 Conclusion:

With technicals aligning and volume building, Cisco could be gearing up for a breakout. Traders should keep an eye on confirmation candles and volume spikes to validate the next leg upward.


📉 Disclaimer: Trading involves risk. Always conduct your own research and consult a financial advisor before investing.

Friday, July 11, 2025

How 3 Bullish Timeframe Signals Suggest a Buy Opportunity on AMD Stock


Advanced Micro Devices (AMD) is showing a promising technical setup for bullish traders. An alignment across the weekly, daily, and 4-hour charts is sending a powerful message: momentum may be shifting in favor of buyers.

This article breaks down how two key indicators—EMA (50 and 200) and the Stochastic RSI—are lining up across three timeframes to support a potential upward move.


Weekly Chart: Breakout in Progress

The first signal comes from the weekly chart, where AMD has broken above a recent resistance level. Price has cleared previous consolidation highs while staying well above both the 50 EMA and 200 EMA, a classic sign of long-term strength.

This breakout is significant because weekly chart patterns carry more weight and often lead to sustained price trends. The bullish separation of price from the 50 and 200 EMAs is a signal that long-term traders are regaining control.


Daily Chart: Reversal Pattern Confirmed

On the daily chart, a clear reversal has taken shape. After a recent pullback, AMD found support near the 50 EMA and bounced higher. The 200 EMA remains below, confirming the overall bullish structure.

This bounce is further validated by the Stochastic RSI crossing back above the oversold region, a strong signal that short-term selling pressure has been exhausted. When momentum indicators and price structure both confirm a reversal, it often leads to an upward follow-through.


4-Hour Chart: Early Momentum Reversal

Drilling down into the 4-hour chart, a timely reversal is unfolding. AMD rebounded strongly from a lower support zone while holding above the 50 and 200 EMAs. Most notably, the Stochastic RSI has crossed bullishly, confirming the momentum shift from sellers to buyers.

This 4-hour signal adds precision to the daily and weekly bullish bias. Short-term traders may use this to fine-tune entries, while longer-term investors may see it as confirmation to scale into positions.


Conclusion: Multi-Timeframe Confluence Supports a Buy Bias

When the weekly, daily, and 4-hour charts align with bullish signals from both price action and indicators like the EMA (50 and 200) and Stochastic RSI, the odds often favor the bulls.

While no signal is guaranteed, this kind of multi-timeframe confluence is rare and valuable. It suggests momentum is building from the ground up—starting with short-term traders and expanding into longer-term buying interest.


Disclaimer:
This article is for educational purposes only and not financial advice. Use a simulation trading account before you trade with real money and learn risk management and profit-taking strategies. Trading is risky and past performance does not guarantee future results.


Tuesday, July 8, 2025

How a Triple Breakout and Daily Reversal Signal Point to a 25% Bullish Opportunity on EURCAD

How a Triple Breakout and Daily Reversal Signal Point to a 25% Bullish Opportunity on EURCAD

📊💶 #EURCAD #ForexBreakout #ReversalPattern #MultiTimeframeStrategy #ForexDayTrade


Introduction
A strong bullish signal has formed on the EURCAD currency pair, capturing the attention of traders using a combination of breakout confirmation and daily chart reversal signals. With a clear confluence across the 4-hour, daily, and weekly timeframes, this technical setup offers a well-supported case for a buy position with an estimated 25% upside, targeting the 1.6100 level. Whether traded intraday or held for a few days, the structure of this trade offers exceptional technical clarity and reward potential.


✅ Key Technical Highlights

🔹 4-Hour Breakout Confirmation

The EURCAD pair has broken decisively above a recent range high on the 4-hour chart. This breakout occurred on increased volume, which validates the move as more than a false spike. Price action shows bullish momentum building as candles close strongly above the 50-period EMA, indicating short-term strength.

🔹 Weekly Chart Breakout Structure

Zooming out, the weekly chart reveals that EURCAD has cleanly broken through a key resistance zone, which had previously capped price several times. The breakout aligns with the long-term trend shift, reinforcing the bullish narrative from a macro perspective. Support now sits firmly below at previous resistance.

🔹 Daily Chart Reversal Signal

The daily chart offers the most critical insight: a strong reversal pattern, potentially a bullish engulfing or morning star, has formed near the breakout area. This suggests a change in sentiment and invites buying pressure as traders react to the clear reversal signal after a recent pullback. This reversal provides timing precision for the trade.


🎯 Take-Profit and Target Projection

The price target is placed at 1.6100, which corresponds to:

  • A previous structural high

  • A Fibonacci extension zone

  • A round psychological number respected historically

The move to this level offers a potential 25% profit window, depending on entry price and lot size. This makes it attractive for both day traders and short-term swing traders.


🕒 Trade Duration Outlook

While this breakout setup is forming across the weekly and daily charts, the 4-hour entry makes it highly suitable for day trading. Traders who prefer intraday execution can look for a pullback to breakout support for entry, followed by momentum confirmation from RSI or volume spikes.

Swing traders may hold the position over several days, aiming for the full stretch to the 1.6100 target, while trailing stops to lock in profits.


⚠️ Risk and News Awareness

Traders must remain cautious of:

  • Oil price movements, which directly impact CAD strength

  • Economic data from the Eurozone or Canada (GDP, employment, interest rate updates)

  • Central bank speeches that may introduce volatility

Risk should be limited by placing stop-loss orders just below the 4-hour breakout level or the low of the daily reversal candle.


📌 Why This EURCAD Setup Matters

This setup is more than just a breakout—it combines:

  • Multi-timeframe confirmation

  • Momentum breakout on the 4-hour chart

  • Weekly structure validation

  • Daily chart reversal timing

These factors build a strong technical case for bullish continuation and provide high confidence for experienced and new traders alike.


Conclusion
EURCAD presents a powerful trading opportunity backed by clear technical signals across major timeframes. With a 25% upside and precise entry timing from a daily reversal pattern, this is the kind of setup traders seek for both fast profits and well-structured trades. Whether approached as a day trade or a swing play, the EURCAD breakout is one to watch.


Disclaimer: This content is for educational and informational purposes only. It does not constitute financial advice or a recommendation to buy or sell any financial instrument.Use a simulation trading account before you trade with real money and learn risk management and profit taking strategies.


Monday, July 7, 2025

How 3 Simple Conditions Turn a Double Top Into a Buy Signal

How 3 Simple Conditions Turn a Double Top Into a Buy Signal

Author: Lubosi Forex

Most traders see a double top and expect a reversal. But in strong uptrends, this pattern can fail — and when it does, it often sets up a high-probability buying opportunity. Traders who use the Rocket Booster Strategy understand how to spot these traps and trade them in the direction of the trend.

Here’s how the strategy works — and why some double tops become launchpads, not ceilings.

1. Price Above Both 50 EMA and 200 EMA

When price remains above the 50 EMA and 200 EMA, it confirms strong bullish momentum in both the short and long term. In these conditions, many reversal patterns like the double top often fail. Instead of selling off, price consolidates and continues higher. Traders using this strategy only look for buy setups when both EMAs are pointing up and price stays above them.

2. Bear Trap Setup

A double top often attracts sellers. These traders place their stop-losses just above the highs. If price fails to break the neckline and instead rallies above the top, those stop-losses are triggered, creating a surge in buy orders. This becomes a trap — not a reversal — and the breakout can be fast and aggressive. The Rocket Booster Strategy takes advantage of this liquidity burst.

3. Entry After Confirmation, Not Assumption

Instead of shorting the pattern, traders using the Rocket Booster Strategy wait for one of two bullish confirmations:

  • A bounce off the neckline without breaking below it
  • A breakout above the second top after the trap is set

At that point, the trend is considered intact, and momentum is ready to continue. The "rocket" is refueled, and the strategy shifts into entry mode.

Trade Setup Example:

  • Entry: Near neckline bounce or breakout above second top
  • Stop Loss: Below neckline or under the 50 EMA
  • Target: New highs and above the pattern top

Final Thoughts

In strong trends, failed double tops are not warning signs — they’re opportunities. The Rocket Booster Strategy filters out weak signals by requiring clear alignment: 

price above both EMAs, pattern failure, and bullish confirmation. When these conditions align, a pattern that looks bearish on the surface becomes a fuel source for the next breakout.


Disclaimer: This article is for educational purposes only. Always do your own research and manage risk appropriately.

Saturday, July 5, 2025

Microsoft (MSFT) 4H Buy Signal: Gap-Up, High Volume, and Stochastic RSI Reversal – Rocket Booster Strategy Explained

-
Microsoft (MSFT) has just triggered a compelling buy signal on the 4-hour chart, with multiple layers of confluence aligning to
-
support a bullish continuation. This setup fits perfectly into what I call the Rocket Booster Strategy — a system built to catch strong
-
upside moves right before they ignite.
-
Here’s what’s happening on the chart:
-
1. High Volume on the 4H Entry Candle

We’re seeing an above-average volume spike on the recent bullish 4H candle,
-
which tells me there’s strong participation behind the move — possibly institutional activity. High volume at key price levels
-
often acts as the first stage of a breakout acceleration.
-

2. Stochastic RSI Reversal from Oversold
-
The Stochastic RSI has curled back up from below the 20 line, printing a clear buy signal.
-
This reversal suggests that upward momentum is returning just as price confirms strength — a powerful combination.
-
3. Price Trading Above Both the 50 EMA and 200 EMA
-
MSFT is now well above the 50 EMA and 200 EMA on the 4-hour chart.
-
This alignment confirms a strong underlying trend. When price is supported by both short- and long-term moving averages,
-
it's a green light for trend-following strategies.
-
4. Bullish Gap-Up
-
The session began with a bullish gap-up, which acts like a "booster rocket" for momentum.
-
Gaps on tech stocks like Microsoft often attract short squeezes and breakout buyers
-
— this one could be the start of a new leg higher.

Strategy Context: Why This Setup Matters

-
The Rocket Booster Strategy works best when these four elements align:
-

  1. Volume spike
  2. Momentum reversal
  3. EMA trend structure
  4. Gap-up catalyst


-
With Microsoft showing all four in perfect sync, this becomes a high-probability continuation entry.
-

Trade Idea (Not Financial Advice)

-
Entry: Current 4H candle close or next retracement
Stop Loss: Just below the gap or the 50 EMA

Target: Previous swing high and extended target based on Fibonacci expansion
-

Final Thoughts

-
Microsoft rarely gives such clean setups, and when it does, it pays to watch closely. If momentum continues, this could set the tone for the rest of the week.
-
Always manage risk — no rocket launches without backup systems.
-
Let me know if you’re trading this setup too or have your own spin on the strategy. Feedback and chart ideas welcome!

Rocket booster engaged for MSFT? 🔥

Rocket Boost This Content To Learn More


Disclaimer:
This analysis is for educational and informational purposes only. It does not constitute financial advice or a recommendation to buy or sell any security.

Always do your own research and consult a licensed financial advisor before making any trading decisions. Trade at your own risk.

Thursday, July 3, 2025

EUR/CAD 4H Technical Analysis – Trend Continuation Signal Forming After Stoch RSI Reset

Author: Lubosi Maboshe
Posted on: July 3, 2025
Category: Forex Strategy & Market Setups


In my last post on the CAD/CHF reversal, I showed how Stoch RSI helped spot a short opportunity. You can read it here. 

Introduction

In today’s 4-hour analysis of the EUR/CAD currency pair, we uncover a classic trend continuation setup supported by both price structure and oscillator signals. This kind of setup is a favorite among professional traders because it combines momentum, market psychology, and technical precision.

If you’re a trader looking for clarity during pullbacks, this strategy offers a high-probability entry based on simple but effective tools: EMA crossover, Stochastic RSI, and clean candlestick behavior.


Market Structure: A Textbook Uptrend

The EUR/CAD pair has shown exceptional strength over the last few weeks. The current 4-hour chart reveals a clear higher high, higher low structure, with price comfortably trading above both the 50 EMA and 200 EMA.

This isn’t just noise. It’s a strong institutional trend fueled by euro strength and CAD weakness — possibly linked to recent oil weakness or shifts in eurozone inflation sentiment.

The market is currently undergoing a natural pullback — and this pullback may be offering savvy traders a prime entry opportunity.


Indicator Confirmation: Stochastic RSI Resetting

Let’s dig into the Stochastic RSI, set at (3, 3, 14, 14), a powerful tool to detect momentum reversals within trends.

  • The oscillator has dipped into oversold territory, with values at 0.44 and 0.29.

  • In the context of a strong uptrend, this suggests a healthy pause, not a reversal — meaning the market is likely reloading before its next upward move.

  • Traders often refer to this behavior as a “reset within a trend” — a critical moment when fear shakes out weak hands and invites disciplined entries.


Dynamic Support Holding Firm

The 50 EMA, currently near 1.59792, is acting as dynamic support, catching price dips and rejecting strong bearish moves. Below that, the 200 EMA sits at 1.57965, further confirming a deep support zone.

This kind of dual-EMA structure is a hallmark of trend strength. Price sitting above both with clean spacing means the trend is still maturing and has more room to go.


Trade Setup: Buying the Pullback

If you’re planning an entry, here’s a simple, structured idea:

  • Entry Zone: Between 1.59800 and 1.60000, once a bullish candlestick confirms support (look for pin bars or engulfing candles).

  • Stop Loss: Below 1.59500 (under swing low and below the 50 EMA to allow breathing space).

  • Take Profit Levels:

    • TP1: 1.61000 (recent swing high)

    • TP2: 1.61800 (next Fibonacci extension and psychological round number)

This trade idea supports a 1:2 or 1:3 reward-to-risk ratio, depending on your exit management — ideal for both intraday and short-swing traders.


Why This Trade Matters

Many traders struggle with knowing when to enter a trend after they “miss the move.” This is where understanding pullbacks becomes a skill edge.

Instead of chasing highs, this strategy teaches patience — wait for the crowd to panic on a dip, then ride the institutional wave.

This setup works not because of magic indicators, but because it respects market rhythm and trend psychology.

You’re not fighting the market. You’re listening to it.


Educational Takeaway

If you’re learning how to trade trends, study this EUR/CAD 4H chart. Here’s what to take away:

  • Let price lead, not indicators.

  • Look for alignment between EMAs and oscillator resets.

  • Enter at key zones — not at the top, not too early.

  • Be patient. The best setups are the ones that make sense even to the eye.

Trading is not about being perfect. It’s about consistency, discipline, and only acting when the odds are in your favor.


Risk Disclaimer

This analysis is shared for educational purposes only and does not constitute financial advice. Always use risk management, protect your capital, and never trade with money you cannot afford to lose.

Past performance does not guarantee future results.


Final Thoughts

The EUR/CAD chart is offering more than a setup — it’s offering a lesson in trading discipline.

With the right entry signal near support and the current structure holding, this pair has the potential to deliver a clean continuation toward 1.6100 and possibly beyond.

Watch for confirmation. Respect your plan. Trade smart.


Have you traded EUR/CAD recently? Do you see the same opportunity forming?
Share your thoughts in the comments below — I’d love to hear your setups and ideas.


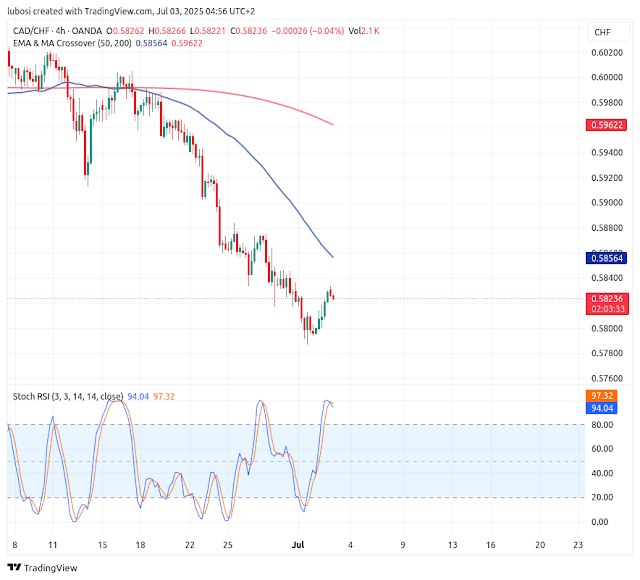
🎯 4H Reversal Trade Setup: CAD/CHF – Is This the Bottom? 📉📈

CAD/CHF 4H Reversal Setup – Stoch RSI Signals Exhaustion 📉📈

Pair: CAD/CHF
Timeframe: 4H
Date: July 3, 2025

---


Market Overview

The CAD/CHF pair remains in a strong downtrend. Price is trading below both the 50 EMA and 200 MA, which are sloping downward. This confirms bearish momentum. After a small bullish bounce, the pair is testing the dynamic resistance zone formed by the 50 EMA.

---

Indicator Confluence

  • Stochastic RSI (3,3,14) is deep in the overbought zone (above 94), suggesting bullish momentum may be fading.
  • Price has failed to break above the 50 EMA (0.58564), which could serve as a resistance barrier.
  • EMA and MA crossover shows 50 EMA remains below the 200 MA, confirming the dominant trend is bearish.


---

Trade Idea: Short Setup

Entry Zone: 0.58240 – 0.58300 (wait for bearish confirmation candle)
Stop Loss: Above 0.58600 (just beyond the 50 EMA)
Take Profit Targets:

  • TP1: 0.57200 (recent swing low)
  • TP2: 0.56000 (next support zone)


---

Strategy Logic

This is a trend-continuation reversal entry, catching the top of a pullback within a bearish structure. The Stochastic RSI overbought condition, combined with resistance at the 50 EMA and overall trend alignment, makes this setup attractive for swing or intraday short trades.

---


Risk Disclaimer
This idea is for educational purposes only. Always apply proper risk management and confirm setups with your trading plan.

---

If you found this helpful, feel free to like, comment, or share your thoughts below. Are you short on CAD/CHF too?

\#CADCHF #Forex #TradingView #StochasticRSI #BearishReversal #EMA #4HSetup #ForexEducation #TrendTrading #PriceAction

Wednesday, July 2, 2025

Trading The 3 Step Rocket Booster Strategy


Trading within a certain time frame has shown me that its better to set a time stop limit.
This time stop limit tells you when to stop trading your entry.
-
Now does this work? am not sure but i will try anything
that will produce results.
-
Right now am focusing on short term trading strategies.The main aim is to enter on 4 hour time frames.
-
Am hoping that this will increase my trading skills.Either way my focuss is on learning how to trade better setups.
-
Key Point:Dont stop journal-ling your trades on trading-view community.
-
Now on this entry am looking at a rising volume from the bottom of the market.
-
Also we are looking at the rocket booster strategy:
-
It has the following steps:
-
  1. -The price has to be above the 50 EMA
  2. -The price has to be above the 200 EMA
  3. -The price has to gap up.

-
This strategy has become so popular its shocking.Because when i began teaching...
-
it it was not as popular.
-
I call it the 3-Step Rocket Booster Strategy
If you want to learn more about how to find
stocks such as KO


-
Rocket boost this content to learn more.
-
Disclaimer:Trading is risky please learn risk management and profit taking strategies.Also do not use margin trading.And use a simulation trading account before you trade with real money.

Tuesday, July 1, 2025

The Top 3 Candlestick Patterns In Buying This Forex Pair


This will be the first time of me trading a breakout strategy.
This breakout pattern happened on the week.
Looking back within this 4 hour time frame.What do you see?

  1. -Doji
  2. -Hanging Man
  3. -Bullish Engulfing


These 3 patterns are working together..How?? let me explain:
The bullish engulfing is showing the surpport level of this price action.Then comes in the hanging man.

The hanging man shows you the resistance level.
Its very clear to see on this chart that the price
has broken resistance and this is a very clear breakout.

That is what my mentor Tim Sykes usually says.Because he loves clear breakouts.

This 4 hour time frame is the key to entry
positions in short term trading.

Rocket boost this content to learn more.


Disclaimer:Trading is risky please learn risk management
and profit taking strategies.Also feel free to use a simulation trading account before you trade with real money.
Also do not use margin.

Visa (V) Buy Signal: 3-Step Rocket Booster Strategy

Visa (V) Buy Signal – Daily Trigger + Weekly Pullback + Rocket Booster   🚀💳📈 Visa Inc. (V)   V   is flashing a compelling buy signal, ...